Now, Children in 40 Classrooms Can Review Their Climate Data
How do you motivate schoolchildren to understand climate data? In Helsingborg, students can directly monitor air quality, electricity use, and food waste in the classroom. The tool is now being rolled out to even more schools.

It is not easy for children to understand climate change. What does the data mean? And above all, how can children themselves make a difference?
In Helsingborg, a digital tool is being rolled out to several of the city’s schools. It is currently available at ten schools in a total of 40 classrooms. In spring 2024, another 15 schools will join the journey.
”The idea actually comes from a parent who wondered why the city does not share more of the sensor data already collected. After all, the data belongs to the residents,” says André Karpelius.
André is a teacher at Västra Ramlösa School. He jumped at the chance when Jennifer Tong of the city’s innovation hub, Hbg Works, forwarded the question to him.
”To make it work, we needed to make the data easier to understand. We set the goal that students from primary to secondary school would benefit from what we were doing. We started going into my own classes and asking what the children wanted to measure and how they wanted to see it. One of the first things that came up was that they wanted to be able to measure air quality outside the school and see how much the air was deteriorating at pick-up and drop-off,” he says.
Particle Content, Electricity Consumption and Food Waste
First, a simple prototype was developed for the children to test. Along the way, they contacted a Norwegian company, Innocode, which builds digital tools for the public sector. Together, they developed a second version.
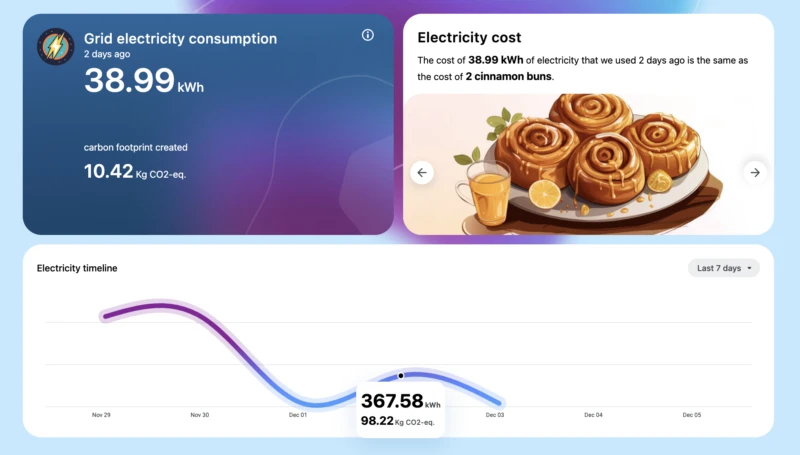
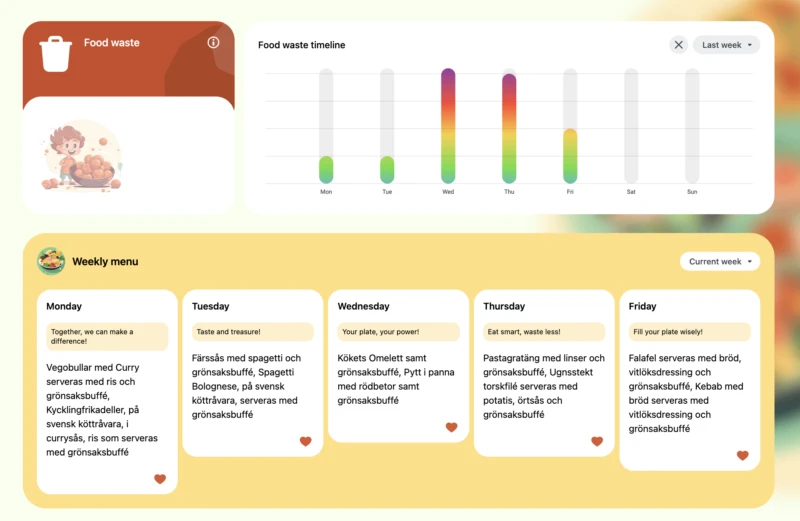
On the tool’s website, students can now monitor noise levels, carbon dioxide levels, and classroom temperature. The data comes from sensors placed in schools. They can also see particle levels in the outdoor air, the school’s electricity consumption and food waste in the school canteen.
”The idea is to have a particle meter in each schoolyard, but right now we have a general one in the centre. Electricity consumption comes from Öresundskraft and food waste is weighed manually,” says Maria Sjödin, UX designer at the City of Helsingborg.
Empowering Students to Make a Difference
The tool compares the data with things students recognise and have suggested themselves. For example, electricity consumption is counted in cinnamon buns and food waste in meatballs. A far cry from the usual graphical bars and charts. But also much easier to understand.
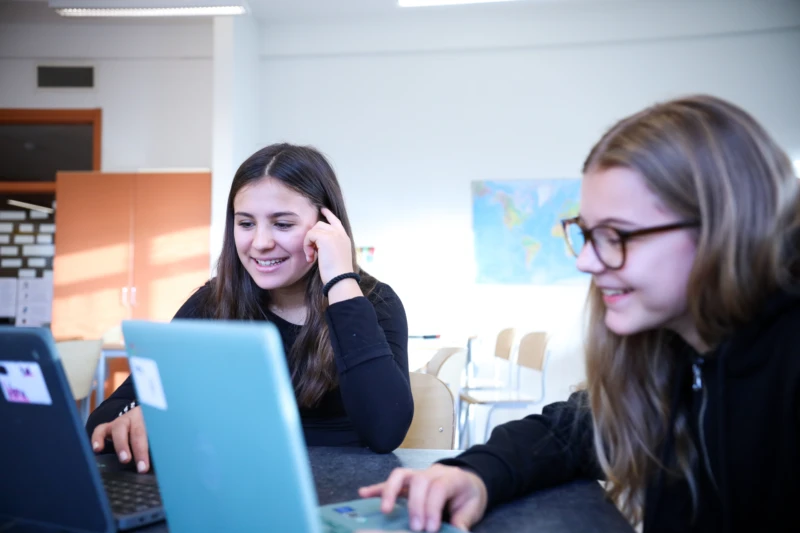
In primary school, teachers show the tool with a projector on the blackboard. In middle and high school, students use their computers to view the tool themselves. Some teachers use the tool frequently, for example, to retrieve material students are working on in maths.
”The benefit is that you get students who feel they can make a difference. We have students who have told their parents that they do not want to be driven to school by car to reduce particle levels. These children will grow up and run this country. You want them to understand this, it is very important,” says André Karpelius.
A Unique Tool That Can Be Disseminated
As far as André Karpelius knows, there is no similar tool anywhere. At least nothing that makes climate data so easy to understand, even for middle school children.
The City of Helsingborg and Innocode aim to spread the tool to other schools in Sweden, Norway and Denmark. The project has received funding from Sweden’s innovation agency, Vinnova. It is also being developed with the support of the strategic innovation programme IoT Sweden.
The tool and the data used by the students in Helsingborg are available to everyone on antiloop.eco.


